Technical Analysis - Candlestick Pattern

     Technical Analysis

Technical analysis is the study of graphs. In these, we check the parameters like price and volumes in the graph or chart. Through technical analysis, you can decide "when to buy" the stock.
Here I am sharing two patterns. so, check it out.

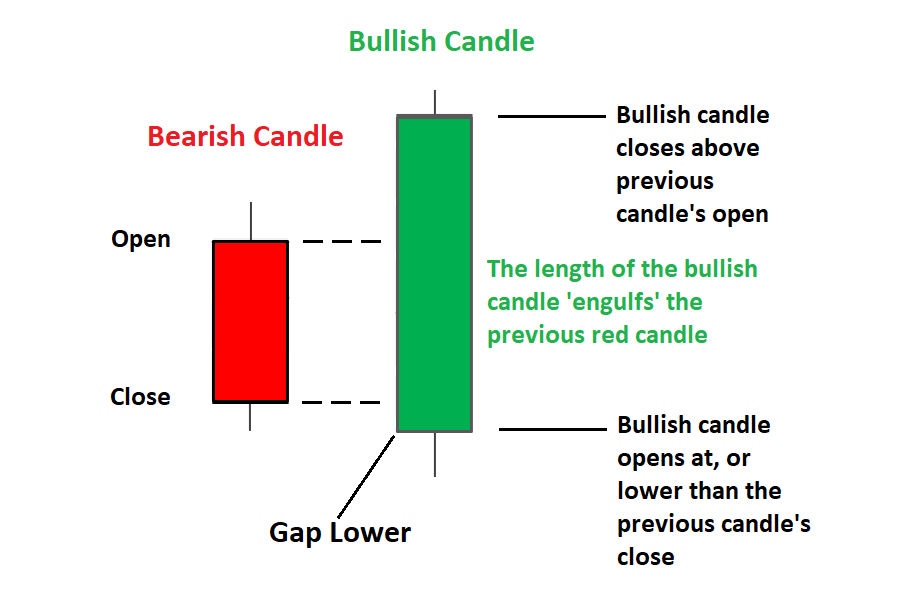
1. Bullish Engulfing

In this pattern, the bullish candlestick (green candlestick) engulf/eats the previous bullish candlestick (red candlestick).


2. Morning Star

It is a bullish 3 candlestick pattern framed at the bottom of the down move or downtrend.
  1. Candle:- Big bearish candle
  2. Candle:- Dogi candle (Indecisive Candle) chart
  3. A big bullish candle closes near the top of the day chart.


Comments

Popular posts from this blog

How to take charge of your time

To take charge of your time, first, you have to analyze your time. Where do you spend your time? In this module, we not going to follow a strict timetable but we have to analyze your time. You can analyze your time by making excel in which you mention what you have done today and find out the effective time ratio. Effective time ratio = 1 - (total time where you spent on unwanted work / total time in this table)

A new journey

 Today, I have watched Ankur Warikoo's course on "How to speak effectively".  And I found out the meaning of writing what we think. So I started this blogspot to share my views and thoughts whatever happening in my life.